Will you run Out of Money one day?

U
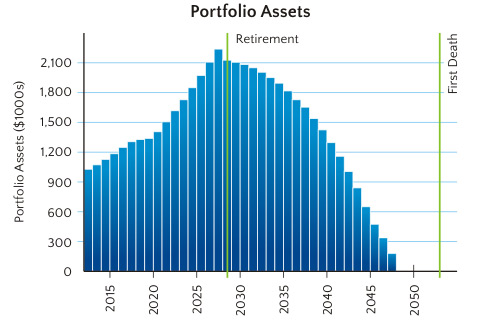
h-oh. This couple is most likely going to run out of money in 2047. How do I know? See those blue bars? Those represent the cash flows that these people are going to have over their lifetime. Notice how the blue bars don’t make it all the way until the end of the chart. That means this couple is not going to have enough to last their entire lifetimes if they continue living the way they do now.
The cash flow graph is based on a projection of current and future assets, liabilities, income, and expenses. We take the assets that this couple has today (cash, investment portfolio, real estate), deduct any liabilities they might have (mortgage, car loans), and add in the income we expect them to make (salary, social security, pensions), while deducting their expenses (food, utilities, college tuition). The data is then crunched to arrive at a cash flow analysis like the one you see here.
The goal is to have the projected net cash flow stay positive over a lifetime, with enough cushion to weather any unexpected events like early retirement, or increased expenses. In this chart, the blue bars disappear too soon. But with some careful financial planning, this couple could make small adjustments in an effort to see their flow turn positive instead.
What does your cash flow look like? Will you have enough to last you for a lifetime, or will you run out of funds sometime after retirement? Contact me for a complimentary financial plan, and let’s find out!
Subscribe
to our Newsletter
Financial PlanningArticles
That is the question! . . . Can I get a tax deduction for my Home Office? Even if you are eligible to take a tax deduction for your home office, there are times it is not worth doing so. Why? . . . Why can't I just hire aFinancial Planner? How do you know who to hire? When you do hire someone, how do you know that they are doing a good job? What happens if . . . The


